LSTM Trading System
A deep-learning trading system: an LSTM forecasts next-day returns and a risk-managed bot trades on them.
- Year
- 2025
- Role
- Solo — final-year dissertation, Loughborough University
- Status
- Archived
- Stack
- Python
- TensorFlow
- Keras Tuner
- pandas
- scikit-learn
- backtesting.py
- Alpaca API
- Docker
The problem
My final-year dissertation asked two questions. Can a Long Short-Term Memory (LSTM) network predict short-term movements in the stock market? And if it can, can those predictions be turned into trades that make money without taking on reckless risk?
Plenty of papers answer the first question with a chart of predicted prices tracking real ones. Far fewer go on to the second, which is where the real difficulty is. A model can look accurate on a chart and still lose money once it has to decide when to buy, how much to buy, and when to get out. So I built the whole pipeline: data ingestion, feature engineering, the model, a trading strategy with risk controls, a backtesting harness, and a bot that can trade through a broker's API.
Constraints
- Markets are noisy and non-stationary. Patterns that held last year may not hold next year, so a model trained once and left alone will drift.
- No look-ahead bias. Every split, scaler and retraining step had to use only data that would have been available at the time. A leak would make the backtests meaningless.
- Limited compute. Training LSTMs and running hyperparameter searches was slow on my hardware. Rolling retraining is central to the design, so the system repeats a full training run every 20 trading days. A heavier architecture would make every one of those runs more expensive, not just the first.
- One person, one academic year, with the write-up running alongside the build.
Approach and architecture
The system is written in Python and split into independent modules (data, features, model, strategy, execution and logging), each built and tested on its own before integration.
- Data. Daily OHLCV (open, high, low, close, volume) data for SPY, the S&P 500 ETF, comes from the Alpha Vantage API. It's sorted chronologically, de-duplicated, and split by time into training, validation and test sets.
- Features. Alongside price and volume, the model gets engineered technical indicators: RSI, MACD, ATR, rate of change, Bollinger Band width, the stochastic oscillator, Williams %R, on-balance volume and daily percentage change. Features are scaled with a MinMaxScaler fitted on the training data only, then cut into overlapping 30-day windows.
- Model. A TensorFlow/Keras LSTM predicts the next day's log return. The model retrains every 20 trading days on a rolling window of recent data.
- Strategy and execution. Predictions pass through a risk layer that decides whether to trade and how much. Backtests run in backtesting.py. For live use, the bot runs the same pipeline against the Alpaca broker API and logs every trade. The whole thing is containerised with Docker.
Key decisions
Predicting returns, not prices
The first versions predicted tomorrow's price. That looks impressive on a chart, because tomorrow's price is mostly today's price, but it makes the errors scale with the price level and hides how little the model is really adding. Switching the target to log returns made the series closer to stationary, kept errors on a consistent scale, and gave noticeably more stable training. The original plan was a 7-day forecast; I moved to a 1-day horizon because it proved more stable and more useful for trading.
Dropping the attention layer I set out to build
The literature suggested adding an attention mechanism to the LSTM, and that was part of my original plan. Rather than assume it would help, I compared four architectures under identical conditions, with three runs each:
- 1 LSTM layer, no attention: RMSE 19.38, directional accuracy 50.25%, bias −15.50
- 2 LSTM layers, no attention: RMSE 20.04, directional accuracy 50.75%, bias −14.78
- 1 LSTM layer with attention: RMSE 30.81, directional accuracy 51.06%, bias −25.59
- 2 LSTM layers with attention: RMSE 35.40, directional accuracy 50.75%, bias −30.02
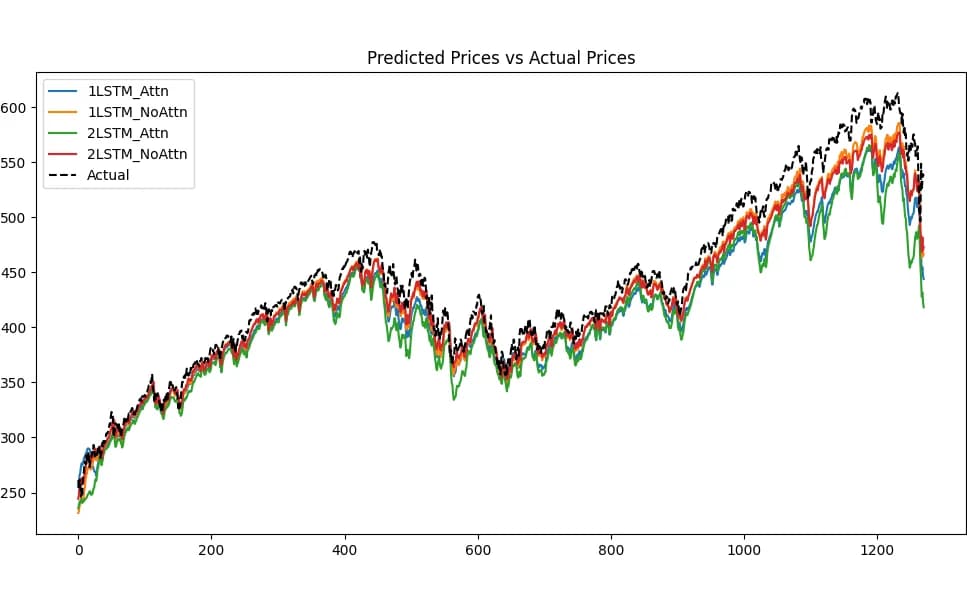
The simplest model, a single LSTM layer without attention, had the lowest error and much less bias. That decided it on accuracy alone, and being the cheapest to train was a bonus, because the system retrains every 20 trading days. I kept the simple model and recorded attention as tested but not used. After tuning with Keras Tuner, its RMSE improved slightly to 19.07.
Feature selection by experiment
I tested indicators in and out rather than adding everything. MACD clearly improved how quickly the model responded to turning points. A simple moving average added almost nothing and smoothed away exactly the inflection points the model needed to catch, so I dropped it.
Accuracy is about 50%, so the risk layer does the work
Directional accuracy sat at around 50–51% in the architecture tests. That's barely better than a coin flip, and I think it's the most honest finding in the project. The model alone isn't a trading edge. What made the system profitable was being selective about which predictions to act on:
- A dynamic confidence threshold. Each prediction is turned into a confidence score adjusted for recent volatility. The threshold follows an exponentially weighted moving average of recent confidence and decays slowly, so the bot only trades when a signal stands out from the recent background noise.
- Confidence-scaled position sizing. Trade size grows with the square of how far confidence exceeds the threshold. Strong signals get more capital, and marginal ones get very little.
- ATR-based exits. Stop-loss is set at 2× the average true range below entry and take-profit at 3× above, so exits widen and tighten with market volatility. A minimum 5-day hold stops the bot reacting to noise, with an earlier stop-loss at 1.5× ATR as a safety net.
Outcome
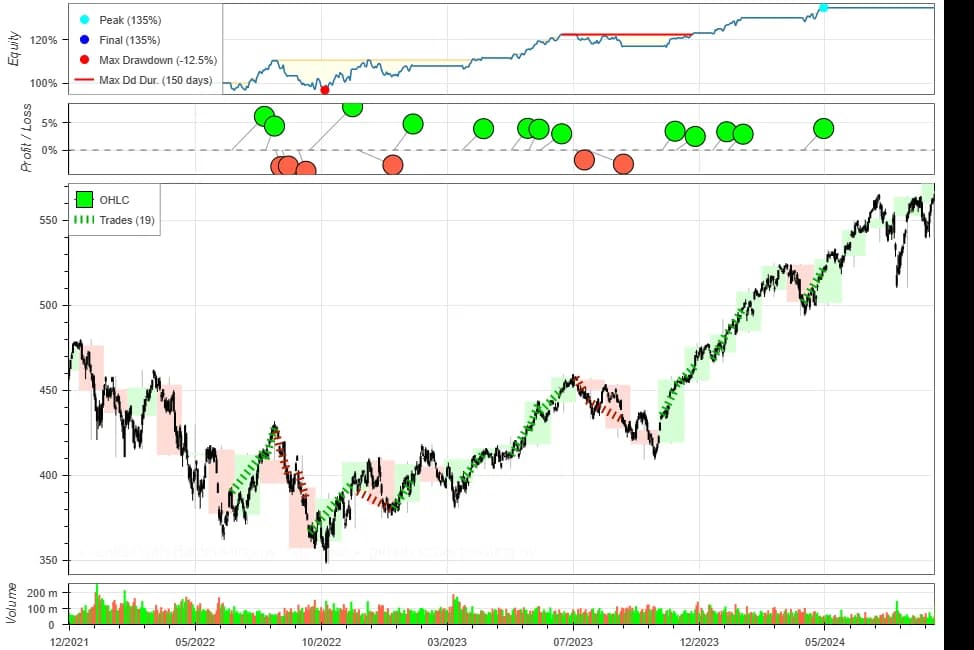
- CAGR on SPY, 2022–2025
- 10.45%
- Win rate on SPY, 2022–2025
- 68%
- CAGR on QQQ, never used in tuning
- 12.63%
- SPY, 2022–2025: 10.45% CAGR, 34.75% total return, a profit factor of 3.17 and a maximum drawdown of −12.47%, from just 19 trades.
- SPY, 2015–2025: 5.13% CAGR, a 62% win rate and a −14.5% maximum drawdown over 69 trades.
- QQQ, 2022–2025: 12.63% CAGR and a 61% win rate on an ETF the model was never tuned on, though with a deeper −28.9% drawdown.
- TSLA, 2022–2025: roughly flat (−0.28% CAGR) with a 43% win rate and a −24% drawdown.
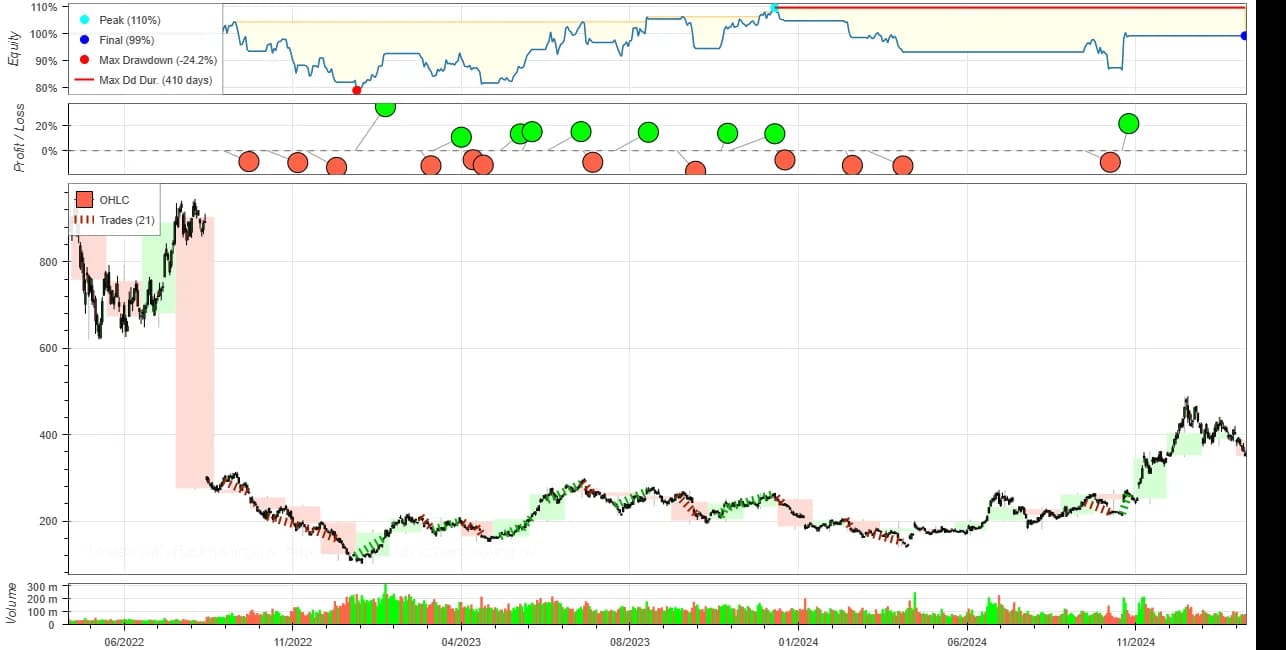
The TSLA result is as informative as the good ones. The strategy works on smooth, index-tracking ETFs and struggles on a volatile single stock, which points to volatility handling as its main weakness. Sortino ratios exceeded 1 on SPY, but Sharpe ratios stayed below the target of 1.
What I'd do differently
- Walk-forward and paper trading before trusting the numbers. All results are historical backtests. With 19–69 trades per test, measures such as the Sharpe ratio and profit factor aren't statistically strong. The next step is walk-forward testing, then a long run on Alpaca's paper-trading account.
- Model volatility directly. The TSLA result suggests predicting expected volatility alongside returns, so position sizing and exits can respond to it rather than only to past ATR.
- Look beyond price data. The model only sees technical indicators, so it can't react to news, earnings or macroeconomic events. Sentiment data was in the original plan and is the obvious extension.
- Try newer architectures fairly. Transformer-based time-series models, or a hybrid with ARIMA, deserve the same head-to-head comparison the LSTM variants got.
- Make it explainable. SHAP values would show which features drive each prediction. That would help with feature selection, and trust and auditability matter for any system that moves money.